Editing User-Defined Pareto Groups
Individual reservoir uncertainties all add up to give a resultant total uncertainty. When a concept contains many parametrized uncertainties, the Single-Parameter-Sensitivity plot doesn’t provide a complete overview anymore. Many uncertainties may appear to have small impact on the observable, but collectively, 'as a group', they might have a very significant impact; e.g. all individual fluid level contacts may have a minor impact, but as a grouped theme they could be a dominant uncertainty. Uncertainty quantification can help to focus on the biggest contributors.
One of the advantages of visualizing uncertainties in a Pareto plot is that you group different (types of) uncertainty parameters. Once grouped, it becomes easier to interpret and communicate the key uncertainties that underlie the selected observable. The relative contribution of the different uncertainties by groups is presented in the Grouped Pareto plot in the Analyze Results View, as % of fraction of the total variability.
This allows you to focus only on the main effects when moving from static to dynamic modeling, and with these insights appropriate action can be taken. The Pareto plot helps QA and QC and aids in determining which groups of parameters to take forward into probabilistic forecasting.
With the User-Defined Groups form, you can create and edit groups from (all) the uncertainty parameters in your study. Grouping is subjective: which parameter belongs to which group has a default assignment in JewelSuite Subsurface Modeling, based on the model type. You can also define your own grouping of uncertainties by defining User-Defined Groups. Each uncertainty parameter must belong to a group. If left undefined, the user-defined group will use the default grouping. This allows you to split the uncertainty parameters over multiple (sub-)groups, in case one group would dominate the Grouped Pareto plot.
Creating and editing user-defined groups
- At the top of the form, select the study of interest. The selection you make here acts as a filter for the rest of the form. All the independent uncertainty parameters of the selected study are listed in the table below. When uncertainty parameters are correlated, it depends on the type of correlation which child uncertainty parameters are listed:
- If the uncertainty parameters are partially correlated, both parent and child parameters are listed.
- If the uncertainty parameters are fully correlated, only the parent uncertainty parameters are listed.
- Click on the
 icon to create a group. By default a group is created with the name 'User-defined group 1'. To rename this group, double click on it to select it and type a new name. You can create as many groups as you like. This allows you to split uncertainty parameters over multiple groups in case one group dominates the Pareto plot.
 - In the table on the right, the uncertainty parameters of the selected study are listed (see point 1). Assign the groups that you created to one or more uncertainty parameters using the drop-down lists in the last column (User-Defined Group) of the table. If you do not assign a user-defined group to an uncertainty parameter, it will be grouped by the default grouping, i.e. by a combination of model type and uncertainty parameter.
- Click Apply to save the settings and keep the form open, or click OK to save the settings and close the form.
- (Re)Run the Analyze Results step and go to the Grouped Pareto tab in the Analyze Results View to view the results.
The lower part of the form is divided in two sections: a list where you create your groups, and a table where you assign a group to an uncertainty parameter.
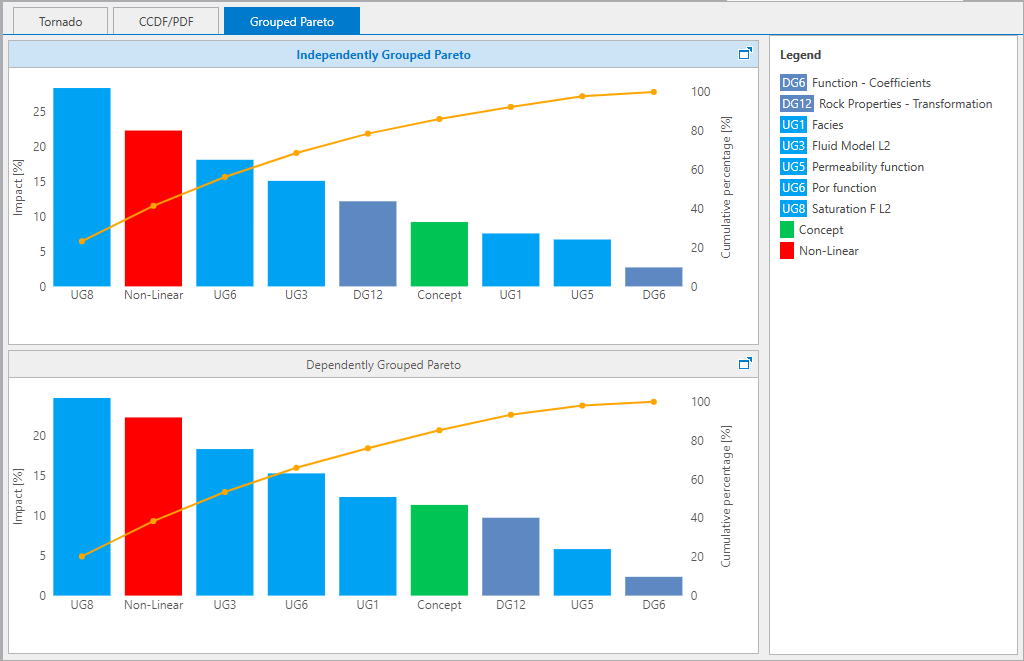
The relative contribution of the different uncertainties by groups on the Grouped Pareto plot. click to enlarge
To illustrate the relative impact of grouped parameters, the vertical bars express the relative impact of a group on the observable. The vertical bars are always sorted by impact: biggest impact to the left. The Pareto plot also shows a cumulative impact line curve that shows the aggregate impact of all groups 'to the left'.
Working with a Pareto plot is usually an iterative process: a common guideline is that you create between 8 to 10 groups, of which 4-5 are key uncertainty groups that make up 80% of the total impact. In most cases, this requires you to change the grouping a few times.
To delete a group, click on the delete icon  .
.
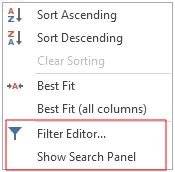
The context menu of the column headers has the options to open the Filter Editor dialog and to open the Search Panel to filter information in the table. click to enlarge
The Filter Editor dialog can be accessed from the context menu of column headers in the table. On the dialog, you can create multiple conditions of filters with respect to model name, model type, default group and user-defined group. You can assign Boolean operators between conditions, or create a group condition, or create a custom expression for filtering.
- On the dialog, use the buttons at the top to change the boolean operator or add a condition.
- Operators Select between 'And, Or, Not And, Not Or' operators to define the operating logic in conditions.
- Add condition Click on the button
 to add a condition. As you add more than one condition filter, the new condition is shown at the top.
 - Change condition type Use the drop down arrow to change the condition type. With 'Add Condition', you add one condition specific to model attributes. With the 'Add Group', create multiple layers of conditions in a group (e.g., filter rock property models, upscaled well logs). With the 'Add Custom Expression', an entry field is shown which opens the Expression Editor dialog where you can create custom expression using logical and math operators.
- At the condition level, there are three fields that you must enter. In the first field, select the attribute for the domain model or the input dependencies.
The related objects are filtered accordingly as you define the condition.
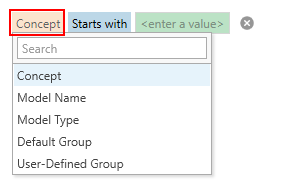

Select the concept any other attribute. click to enlarge
- Next, select the logical operators from the drop down list. The default selection is 'Starts with'.
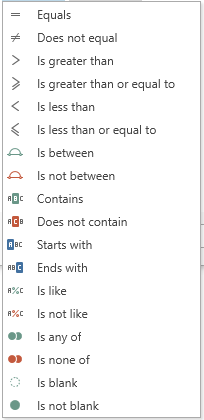

Select the logical operator from the drop-down. click to enlarge
- In the last field, you enter the value which will be used as filter keyword in combination with the logical operators. You can also use the drop-down arrow to select the objects which were filtered based on your selection in step 2. For example, if you select 'Model Type' in step 2 then the drop-down options will list the domain model types in the concept. You can sort the list based on Value (alphabetical) or Quantity.
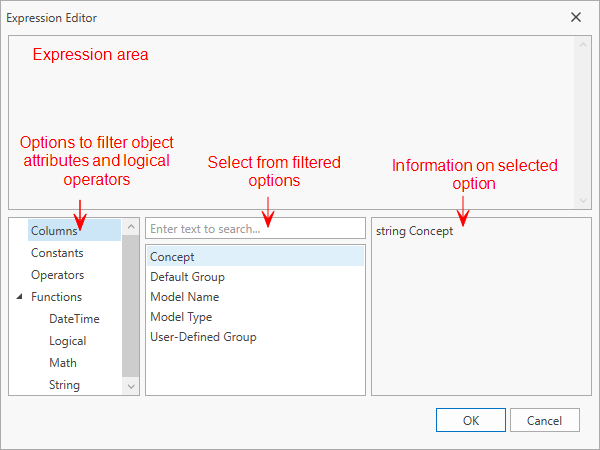
- If you are using a custom expression to define the filter condition, click on the field with Enter an expression... to open the Expression Editor dialog. Use the various options, as shown in the image, to create an expression. Click OK to save the expression and close the dialog.

Select the logical operator from the drop-down. click to enlarge
- To delete a condition, hover the mouse at the end of the expression and click on the delete
 icon.
icon. - Once you defined the filtering conditions, click Apply or OK to display the filtered data in the dependency table at once.